

For the past six years I’ve been building programs that discover networks from various types of data. Why? Because as Laura said last week, what we do has had immediate applicability in helping our country solve incredibly hard and critical problems. But one may still wonder, why is the ability to discover networks amongst data important? Great question, let’s dig into networks and why they are a big deal.
At its simplest, networks are sets of entities consistently interacting over time – but they also represent what you’d expect; groups or systems of interconnected people or things (like a bank account or mobile phone). Our approach has been to characterize data graphically, with edges indicating interactions between entities (nodes). Once we identify a network, we build its graph by filtering out all edges except those connecting network members. This simple idea, along with some amazing insight from some smart people, has led to surprising and marvelous results.
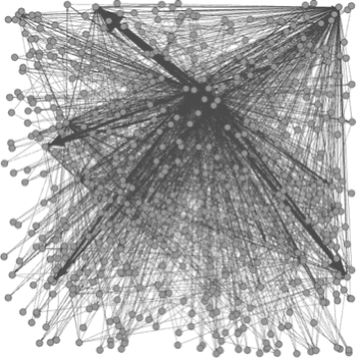
Data Universe Graph
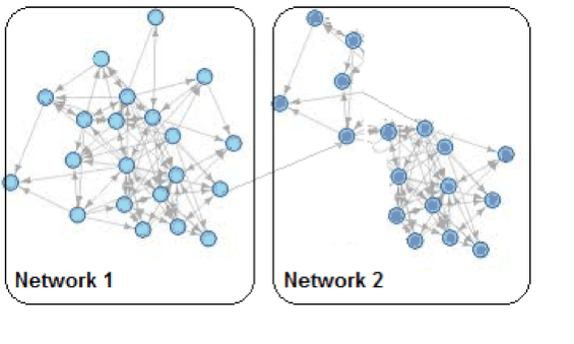
Extracted Network Graphs
One interesting finding uses the network graph structure to identify entities performing similar roles within (or between) networks. Testing has shown that similarity in the structure of the extended neighborhood of two individual entities is a strong predictor of correspondence between the roles the entities perform. Think about that – from data as varied as Tweets, email exchanges, or even ship locations, we can build networks and use the structure of the network graphs to identify individuals (persons or ships) performing similar roles.
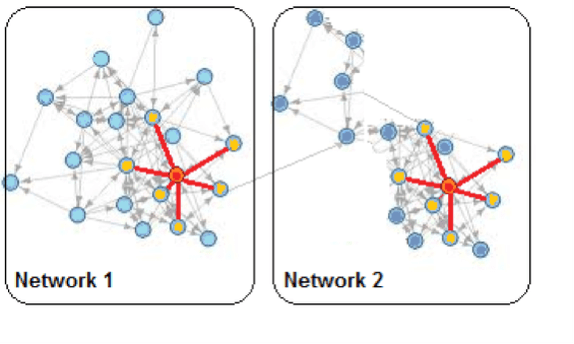
Two Networks Containing Nodes with a Similar Graph Structure
REAL WORLD USE CASE: USER BEHAVIOR FROM FACEBOOK ANALYSIS
Our team validated this approach using 2005 Facebook data from two American universities. The input graph consisted of nodes representing Facebook accounts linked with edges between friends. Our algorithm found networks of users at each university. We built graphlet signatures for each entitiy within the networks. A graphlet is an induced subgraph of (upto) a specified number of nodes, in our case four. Graphlet signatures indicate the structure surrounding nodes within a network graph. By grouping the nodes with similar graphlet signatures, we were able to identify five different sets of user accounts. Four of the sets generally correlated to students in the same class (Freshmen, Sophomores, Juniors, Seniors)- and the fifth set consisted primarily of graduate students, professors and instructors.
In my book, the ability to glean knowledge about roles (student/instructor) and even status (class) from patterns hidden in the connections of a social networking site is pretty amazing. The security and marketing applications for this type of algorithm are obvious, but the process speaks to something much deeper. It shows us that our interactions are intertwined with our positions and our responsibilities. Even relatively benign interactions, like friending people on Facebook, leave behind traces of who we are and what we do.
The power of analyzing networks is something we are constantly looking at, even beyond our work in healthcare fraud and network security. Another example that comes to mind is how we use Google’s Page Ranking algorithm to determine the significance (in terms of interactions) of each member in a network. And we track changes in interactions through time to find networks that react anomalously to specific events. We can even use network reactions to pinpoint when significant network events occur. The creation of these networks gives us insight into groups of interacting individuals and allows us to find the underlying structure of interacting entities. But what it tells us, of course, depends on the data we feed into the process.
REAL WORLD USE CASE: SOCIAL NETWORKS IN KABUL
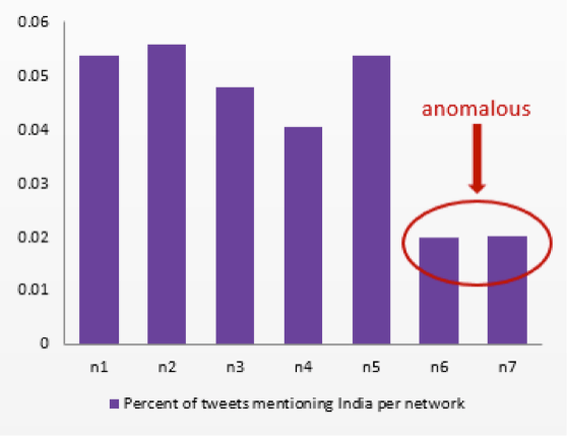
This application was used by my colleague Jonathan Mugan, who collected tweets from Kabul, Afghanistan between September 29, 2011 and October 7, 2011. Jonathan then built a graph of interconnected nodes (people), with edges between the senders of tweets and others mentioned in them. Using this data, our network identification algorithm found seven different networks. Next Jonathan found an event of significance that occurred in the area (on October 4, 2011, Afghanistan signed a strategic partnership agreement with Pakistan’s traditional enemy, India). Using this event, he ran our algorithm to look for anomalous reactions in his networks.
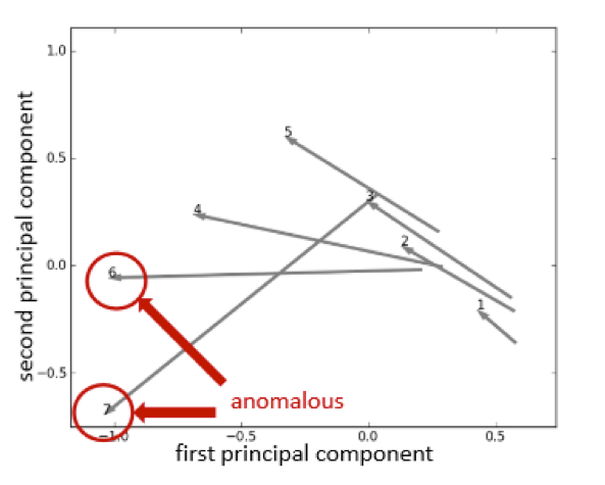
DeUmbra’s algorithm measures network reaction by computing twelve Social Networking Analytic metrics. It uses Principal Components Analysis (PCA) to select the two principal components from these metrics. The program plots the reaction of networks in two dimensions by drawing vectors for each network. Once the vectors are drawn, identifying anomalous network behavior is as simple as looking for vectors pointing in different directions from the norm.
In his example, Jonathan identified two anomalous networks and was able to validate the results by examining the content of the tweets.
It is easy to envision scenarios where an analyst may want to target a network based on an anomalous reaction to specific events. Depending on the event, an anomalous network reaction might indicate a set of potential terrorists, or in a marketing sense, a group of prospective customers. So finding and examining networks has led to the discovery of a host of unexpected and useful information. The “big deal” with networks lies in the things we can do with them and the things they tell us about their members. The fact that we get to do this type of work that has a direct impact on our lives each and every day is the reward.